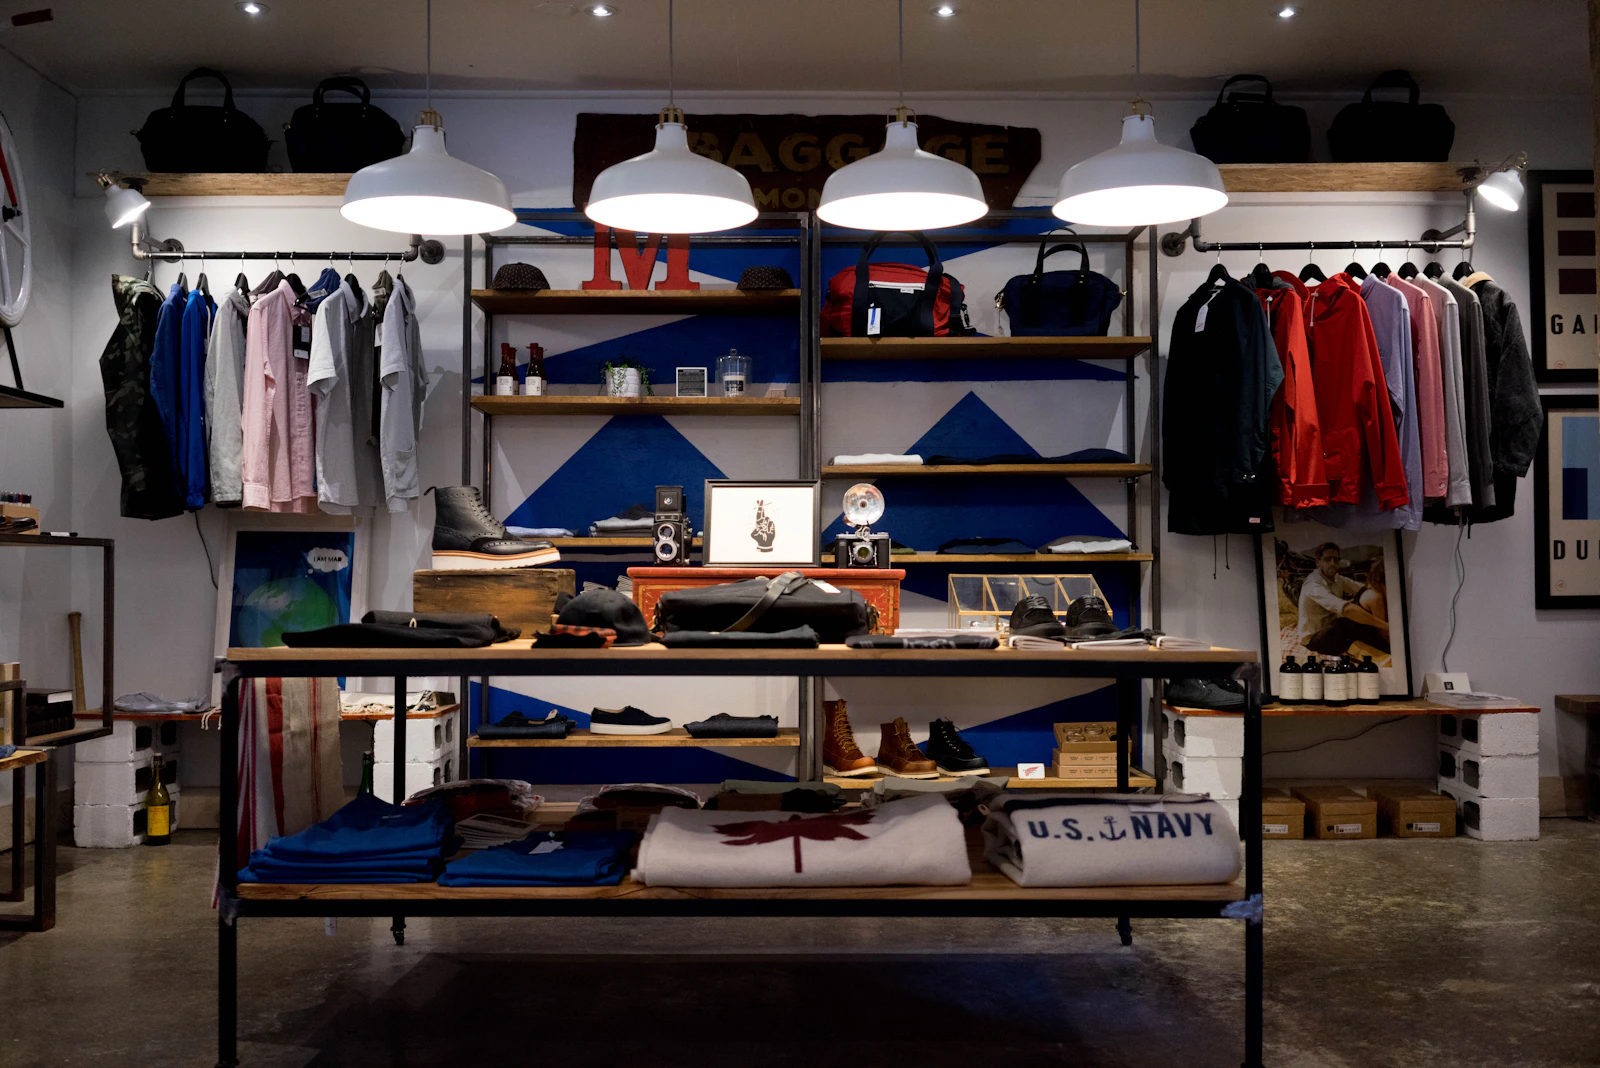
D2C brands were born measuring everything. Online, you know your click-through rate, your add-to-cart rate, your funnel drop-off by step, and the exact path a visitor took before they bought or bounced. Then the same brand opens physical stores and suddenly goes half-blind. The only number that reliably comes back from a store is revenue, and revenue alone cannot tell you why one store outperforms another or what to do about it.
This is the offline analytics gap, and for multi-store D2C brands it is one of the most expensive blind spots in the business. Retail store analytics for D2C brands exists to close it, and the good news is that most of the data you need is already flowing through cameras you have installed.
Why revenue alone misleads you
Revenue is an outcome, not a diagnosis. When you rank Store A above Store B on sales, you are silently blending together a dozen different variables: location and catchment, store size, staffing levels, product mix, and, above all, how many people actually walked through the door. A store can post strong revenue while quietly converting only a small fraction of its visitors, and a store can look weak on revenue simply because fewer people passed by.
To measure store performance beyond revenue, you need to separate traffic from conversion from experience. Otherwise every decision about layout, staffing, and promotions is a guess dressed up as a number.
The metrics multi-store D2C brands are missing
Here are the signals that turn a store from a black box into something you can actually manage.
Footfall, counted automatically
Most stores still count footfall with a manual clicker or a staff member's rough estimate. It is inconsistent between people, it misses the busiest moments, and it can never be broken down by hour or entrance. Automated store footfall analytics gives you a continuous, accurate count, which is the denominator for almost everything else.
Visitor-to-buyer conversion rate
Once you have footfall, revenue and transaction counts turn into a footfall-to-conversion rate: what share of people who walked in actually bought. This single metric reframes the whole business. A store with lower revenue but higher conversion may be your best-run location; a high-revenue store with poor conversion is leaking money you can recover.
Like-for-like store comparison
Normalising by traffic lets you run a fair multi-store performance comparison. Instead of "Store A did more revenue than Store B," you can say "Store A converts 22% of its visitors and Store B converts 14%, on similar traffic," and now the comparison points at a cause you can fix.
In-store customer journey and layout
Today, store layout is mostly guesswork, arranged around intuition rather than how customers actually move. In-store customer journey analytics and a retail store heatmap show real paths, dwell time, and hot and cold zones, so you can see which displays pull people in and which corners never get visited.
Walk-in demographics and audience persona
Are the people walking into a given store the customers you designed it for? Aggregate store customer demographics such as gender split, age bands, and the share of families with children tell you whether each location's real audience matches its target persona, and whether your merchandising fits who actually shows up.
Occupancy, peak hours, and staffing
Store occupancy monitoring and peak-hour patterns reveal when each store is actually busy, which is often not when the roster assumes. That turns retail staff scheduling by footfall into a data decision instead of a gut call, and it feeds directly into queue and checkout experience.
The value, in three pillars
Customer experience
When you staff to real peaks instead of a fixed rota, queues shorten and shoppers get help when the store is busiest. When layouts are built around actual customer journeys rather than assumptions, people find what they came for and discover more along the way. Experience stops being anecdotal and becomes something you can measure and improve store by store.
Revenue
Conversion data shows you exactly where sales are leaking, and comparison data lets you take the playbook from your best-performing store and replicate it across the fleet. Because you now have a stable footfall and conversion baseline, you can also measure the real impact of a promotion or a layout change instead of hoping it worked.
Safety and security
The same cameras support CCTV video analytics for retail on the safety side: occupancy limits during busy periods, and alerts for incidents and loss-prevention events. One system protects both the top line and the store itself.
You already have the cameras
The reason this is finally practical is that it runs on the CCTV you already have. There is no new hardware to roll out to every store, and the approach is privacy-first, built on aggregate patterns rather than identifying individuals. If you run multiple stores and want to see the retail use cases in more depth, our retail video analytics overview breaks down how HyperDecode applies to each part of the store.
For a digitally-native brand, closing the offline analytics gap is not a new capability to invent. It is the same measurement discipline you already live by online, finally pointed at the store floor.